Remote operation of Spectrometer (Windows Remote Desktop)

General

Remote operation of the spectrometer gives you the same control you have when physically sitting at the spectrometer computer.  There is no need  to be logged in and have ICONNMR running prior to remote access as required for the ICONNMR based web server.  Only your samples need to be placed in the sample changer or inserted in the magnet ahead in time.  So you can prepare samples during the day, leave them in the sample changer and run them later from your office or from home, or you can check on an experiment started earlier.

Off Campus Users

Access from outside the UWM campus requires the user to be connected to the UWM VPN (Virtual Private Network).  Please follow the links below how to install and run the Global Protect VPN software.

Installing GlobalProtect:

https://kb.uwm.edu/83286 (Windows) https://kb.uwm.edu/83289 (Mac)

Connecting to VPN:

https://kb.uwm.edu/89581(Windows) https://kb.uwm.edu/89582

Running Windows Remote Desktop Client

The remote desktop client is part of the standard Windows 10™ installation.  It can be accessed from the Windows Accessories in the Start menu.

You can also find it be typing “Remote” into the search bar.

Connecting With Remote Desktop Client

In the main Remote Desktop window, enter the full host name of the spectrometer.  For the Avance 500 instrument, that is nmr500.chem.uwm.edu, for the 400MHz spectrometer it is nmr400.chem.uwm.edu.  Then click the [Connect] button.

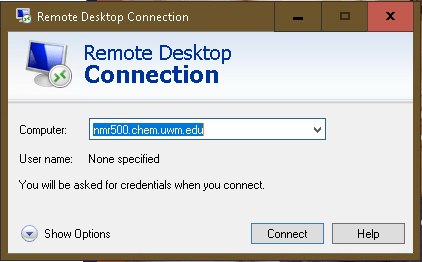
Expanding on “Show Options” allows to save your username in a profile and pre-define window sizes.  Full Screen is recommended.


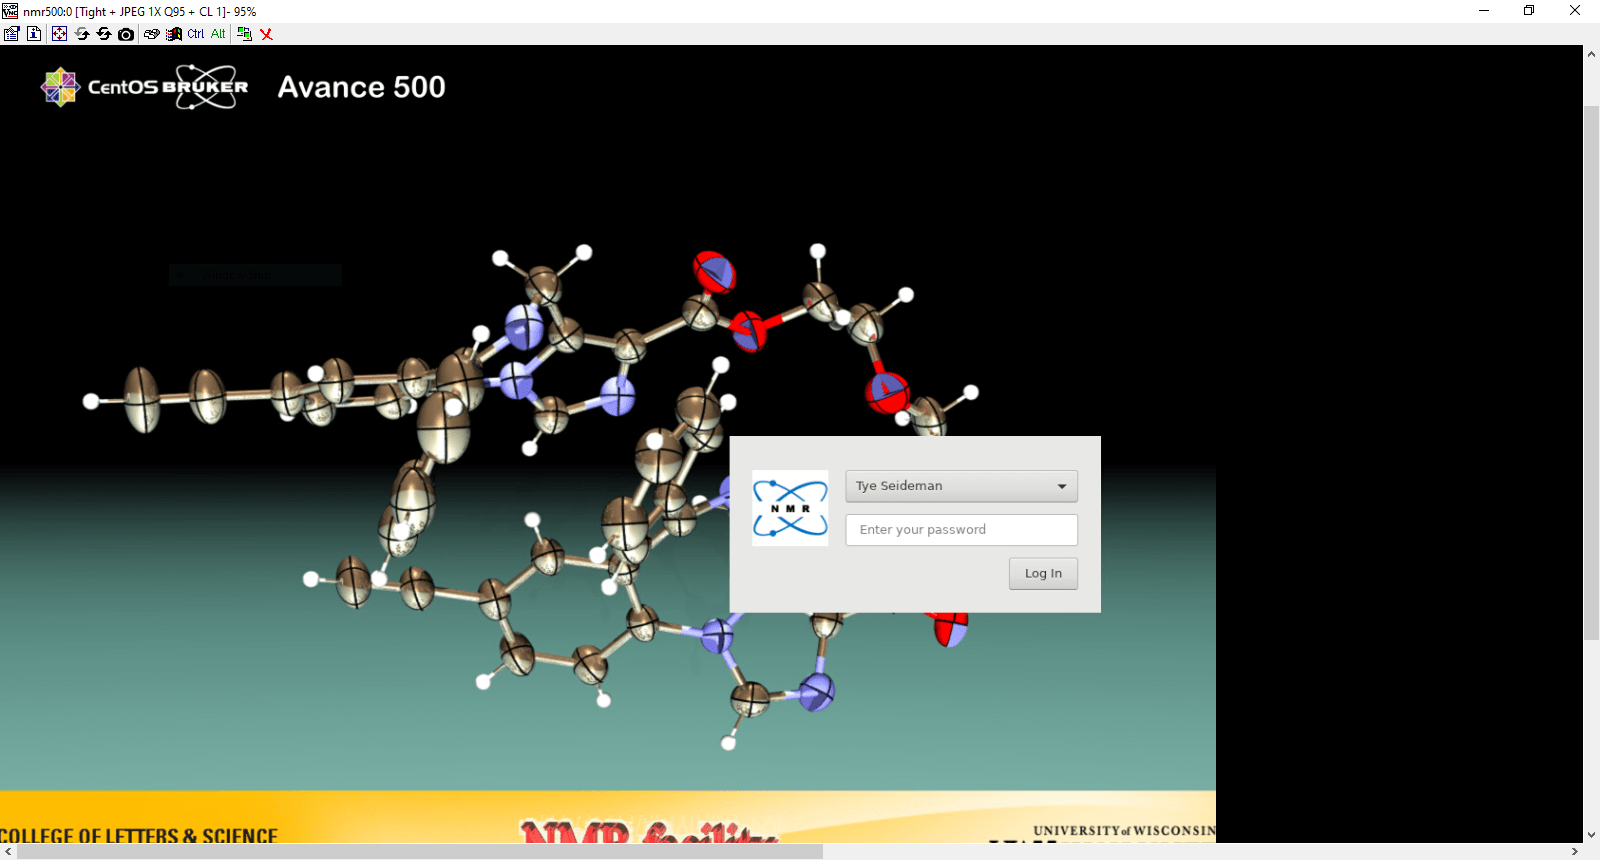
In the server login window, keep the default session “Avance 500 Main Desktop” and enter your username and password (Username may already be filled in if entered in the previous window.

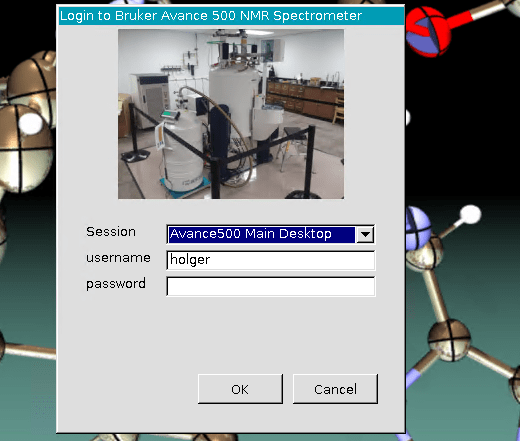
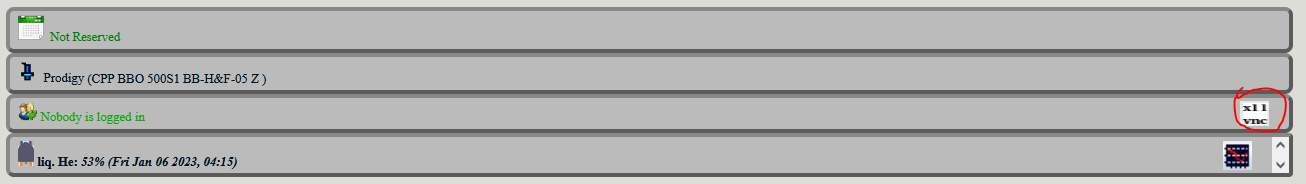
This will log you into the desktop currently running on the spectrometer.  If nobody is logged in, that will give you the main login screen as you would see when in front of  the computer directly.  This behavior is different from connecting to a Windows computer, where you automatically lg into a new session.

If the remote screen is larger than yours, you may need to scroll to find the relevant part of your screen.  Unfortunately, as opposed to the Turbo VNC viewer, zooming of the display is not possible in full screen mode.

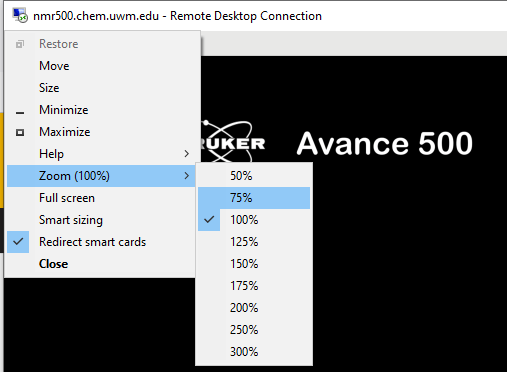
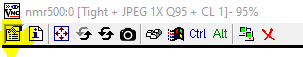
Zooming is possible in window mode.  Exit full screen mode by clicking on the restore windows icon on the tab on top of the window.

Then, click on the icon in the top left corner to access display options.  Note that on small monitors  zooming out may give you the full screen, but at the cost of readability.  Returning to Full screen is only possible after setting zoom back to 100%.

Structure Elucidation from 2D Spectra using Topspin CMCse module

The Structure Elucidation module in Topspin allows software assisted assignment of organic molecules using two dimensional COSY, HSCQ and HMBC spectra. A thorough description of all features of the module is beyond the scope of this knowledge-base entry. Links to the full manual and videos demonstrating the usage are at the end of the article.

The module is included in the standard Topspin distribution. The program runs with the free academic license, but some features are only available with the full CMCse license. The department

Summary

  • Automatic peak picking and creation of correlation table
  • Manual editing or picking of Peaks from spectra or correlation table
  • Management and overlay of multiple data sets and assignments
  • Manual assignment of partial of full structure using fragment tool
  • Automatic assignment of given structure (full license)
  • Generation of target structures compatible with the spectra (full license)
  • Ranking of structures based on 13C chemical shift

https://www.bruker.com/en/products-and-solutions/mr/nmr-software/cmc-se.html

Input Data

 Essential Spectra

  • 1D Proton. Preferably quantitative
  • Edited C13-HSQC (regular HSQC will not get multiplicities right). You need to have CH/CH3 pointing up, CH2 down.
  • HMBC

Other Spectra supported for Structure elucidation

  • COSY. If you use dqfcosy, you need to process in magnitude mode (xf2m)
  • 1D carbon
  • 2D 15N-HSQC and 15N HMBC
  • 13C ADEQUATE

Spectra supported for manual analysis

  • NOESY/ROESY
  • TOCSY, HSQC-TOCSY

Other

  • Molecular Formular (required, can be changed during analysis)
  • Known Fragments (from MS, knowledge about chemistry, or manual analysis)

Starting the Program

Ideally, all spectra are saved with the same data set name and different experiment numbers. That results in the easiest way to add the spectra to the project. Pull up one on the spectra on the screen, then open the CMCse module:

  • On the command line, type cmcse
  • From the [Analyse] toolbar, select [Structures]->[cmcse]

If you don’t have any recent projects, the [Create New Project] dialog will come up. If there are projects in your history, a list of recent projects will come up. Select one, or click the [New] button to create a new project.

CMCse New project dialog
  • A molecular formula is required. If you are not sure about the molecular formula, you can enter a first guess which can be changed later, but many automated functions like peak picking and assignment will not work properly without a correct MF.
  • The list of spectra will be populated with all spectra from the current data set name. Other spectra can be added using the [Add] button, but the search function used is somewhat clumsy to use.
  • Remove any spectra you don’t want to be used of that are duplicates.
  • Click [OK] to proceed

There will be two windows. The Topspin window will display the spectrum overlays, the new CMC-se window the correlation table, the structure window and the menu for program control.

The windows can be arranged using the Arrange Frames dialog.


Picking Peaks

Select [Start Automatic Spectrum Analysis] from [Analysis] menu. This will perform an automatic peak picking of all 2D spectra selected and build a correlation table based on the molecular formula.

Check the consistency report for problems and check the line below the top menu for found fragments and the correct number of protons and carbons. Missing carbons or protons will be highlighted in red.

Automatic Analysis found the correct number of protons and carbons
Missing carbons or protons highlighted in red

In many cases, there will be problems that need to be corrected before one can proceed with any of the automated assignment or structure generation routines. The details of manual editing/checking can vary but should include the following:

  • Removing correlations from the spectrum or correlation table
  • Adding correlations to a spectrum or correlation table (right click on a cell in the table, select “Add multiplets manually” from the spectrum display or right click on the spectrum and select “Define Multiplet”. .
  • Check the #H and Equiv columns in the correlation table to ensure correct multiplicity of the carbon and correct symmetry (in a phenyl group, ortho and meta CH would have Equiv=2)
  • Sometimes you need to remove an atom from the correlation table: Right click on atom name (left column) and select Clear all Atom Information
  • If you are not sure about the molecular formula or there are considerable impurities in the spectrum, you can skip Automatic Analysis and pick all signals manually.

Manual Assignment

Open the Fragment tool by clicking on the icon in the top menu bar if it is not already open.

The Structure/Fragments window will open on the right of the CMC-se window. The size of the window can be adjusted. The window will show balls for the building block fragments (C,CH,CH2,CH3) generated by automatic or manual analysis of the spectra

Fragment tool window with building blocks and partial structure loaded

Within the fragment tool, you can do the following:

  • Draw a complete or partial structure using the drawing tools
  • Add a pre-defined fragment using the template button on the left menu bar
  • Upload an existing structure file in MDL .mol format
  • Clicking on the building blocks will show the correlations (COSY,HMBC) connecting that block with others
  • You can use the drawing tool to connect blocks with a bond or you can drag those blocks into a partial or completer structure using the displayed correlations as a guide.
  • Identify wrong or long range assignments from the correlation table
    • Clicking on an assigned atom will highlight the correlations in the correlation table
    • Clicking on a correlation in the table will display the correlation in the structure
Assign structure by dragging building blocks into position guided by the displayed correlation

Automated Assignment (full CMC-se license required)

From the top menu, select [Structure]->[Verify Structure…] and select [File on Disk] from dialog. Click [OK] and browse to the mol file with your structure.

After a few seconds, the Structures window will pop up displaying possible assignments, ranked by predicted C-13 shift will be displayed. The Highlight Correlations function should be used to display invalid correlations. Implausible correlations should be checked for possible overlap,wrong assignment or weak intensity in the correlation table/spectrum.

Example result for a automatic structure verification. Green color represents good match with predicted shift, red color represents a bad match.

Structure Generation (full CMC-se license required)

If no target structure is known (natural product or unexpected reaction), or alternate possible structures are to be checked for, the [Structure]->[Generate Structures ] function can be used to generate all structures compatible with the given spectra. This is particular useful for drug discovery from natural products.

A dialog window will open up to set structure generation settings.

  • Set allowed/required/forbidden ring sizes
  • You can use fragments defined previously in the fragment tool to restrict possible structures
  • Select which type of correlations to include. Including ADEQUATE can greatly reduce the number of possible structures.
  • Important: Allow for a sufficient number of correlations to be long range. The maximum number of eliminated correlations may need to be tweaked to get structures. Violated correlations need to be checked in the final structure, and the spectra should be checked for wrong assignment or particularly weak correlations. Those should be corrected or eliminated.
  • Set chemistry rules. Some groups (peroxides, nitro) are not tried by default.
  • Click [Generate Structures] to begin. Depending on the settings, this can take a while. If no structures are found, increase number of eliminated correlations or check peak tabl for wrong or ambiguous assignments.

The structures will be ranked by agreement with predicted carbon chemical shifts. Valid or invalid correlations can be displayed using the “Highlight Correlations” tool . Clicking on a correlation in the spectrum or correlation table will also display that correlation in the structure.

Generate Report

A final report in pdf format can be created. That report will list the selected structure, the assigned proton and carbon shifts as tables and annotated spectra, and correlation of predicted and observed chemical shifts.

Further Resources

The full official documentation on the module can be accessed by selecting [Help]->[Structure Elucidation Manual] from the top menu in the CMC-se window, or it can be downloaded from the link below:

Bruker CMCse Documentation in PDF (From NMR Lab website)

Slides from Bruker Webinar (From NMR Lab website)

Videos demonstrating the usage of the module:

Video outlining usage of CMCse module from Bruker.com

Video of data analysis using CMCse by Frank H Foersterling

Remote operation of Spectrometer using VNC Viewer

General

Remote operation of the spectrometer through VNC (Virtual Network Computing) gives you the same control you have when physically sitting at the spectrometer computer.  There is no need  to be logged in and have ICONNMR running prior to remote access as required for the ICONNMR based web server.  Only your samples need to be placed in the sample changer or inserted in the magnet ahead in time.  So you can prepare samples during the day, leave them in the sample changer and run them later from your office or from home.

VNC Server

The VNC server (x11vnc) is automatically started on demand when a connection is attempted, so there is no need to manually start a VNC server.    The server runs in so called “localhost” mode, which means that access requires a login to open a secure tunnel to access the server.  Access is possible from any computer located on the UWM campus or any outside computer that is logged into the UWM VPN through Global Protect.

Off Campus Users

Access from outside the UWM campus requires the user to be connected to the UWM VPN (Virtual Private Network).  Please follow the links below how to install and run the Global Protect VPN software.

Installing GlobalProtect:

https://kb.uwm.edu/83286 (Windows) https://kb.uwm.edu/83289 (Mac)

Connecting to VPN:

https://kb.uwm.edu/89581(Windows) https://kb.uwm.edu/89582

Runing the VPN Client

For ease of use, VPN client executable and pre-configured startup files are available through the NMR lab website and the NMR lab file share employing the TurboVNC software.  There is no need to install VNC software on your computer, but you need to have Java installed on your computer.

Starting VNC client from the NMR lab website (obsolete, use file share as described below)

Go to the NMR lab instrument status page:

http://hal.chem.uwm.edu/nmr

or select “Instrument Status” from the [Local Resources] menu of the NMR lab home page:

On the Dashboard, go to the section of the instrument you want to connect to and click the [X11VNC] icon:

Download the file (turbonvnc-nmr500.jnlp), then open the file from your browsers downloads menu.

Starting the VNC client from the NMR lab File Share

If you are using a UWM managed computer, the file shares are automatically mapped as S:\ drive.  On your personal computer, follow the instructions below to map the drive:

https://kb.uwm.edu/uwmhd/57916 (Windows)  https://kb.uwm.edu/uwmhd/53627 (Mac)

Locate the drive in Windows Explorer, then navigate to the TurboVNC directory on the NMR lab file share: S:\_U_LS\ResearchGroups\NMR\Programs\TurboVNC

Windows users, click on the Windows Batch file appropriate for the instrument you want to connect to.  For the Avance500, that would be nmr500.bat, for the 400MHz instrument, nmr400.bat..  Mac/Linux users use the corresponding.command file.

Connecting with the VNC Client

If you are using a UWM managed computer,or if you are using your UWM Panther ID as login on your computer, just click “Connect” at the bottom of the Window:

If necessary, set your login ID:

If the login on your PC is different from your PantherID, you need to go to [Options…] and set the “SSH user” at the bottom of the [Security] tab to your Panther ID (the login name you use to log into the spectrometer.  The settings will be remembered the next time you connect.

Next enter your password when prompted:

The VNC viewer will show the spectrometer computer window as it is displayed on the console.  If nobody is logged in that will be the login screen.

Set screen size

Depending on the size of your monitor, you may need to resize the screen to best fit your needs.  On small monitors, You want to minimize scrolling , but still be able to read the screen.

To adjust the scaling, select the options menu with the left most button of the top menu:

In the connections Tab, set a proper scaling factor.  Note that you can chose from the pull down menu or type in a number (in %)

Best adjust for the screen to vertically fill the window.  The [Auto] option will try to horizontally fill the window, but since the Avance500 has two monitors, this will display both monitors with insufficient vertical scaling.

You can maximize the available window by entering full screen mode (icon on top menu).  Exit fullscreen mode with the [F8] function key and unchecking the full screen option.

To end the session, but to remain logged into the spectrometer, disconnect clicking on the X button (right most button of the Top menu.

To log out of the instrument, use the finish command in Topspin or do a system logout on the spectrometer.  That will also disconnect your remote session.

Recovering from hangups of power glitches

Topspin Window Locked, desktop responding

  • If you are running automation, you may have timed out and were logged out of ICONNMR.  That will also lock certain functions in the main Topspin window.  Click on the [Change User] button on the bottom right of the ICONNMR window to log back in.
  • If you are not using automation, check for any pop up window, possibly hidden behind the main window, that requires you to confirm [Ok] or [Seen] in order to release control.
  • Exit Topspin by selecting [Terminate Application] from the top left file menu, then restart from the Favorites section of the Start menu.

  • If the Topspin menu is locked, find the terminal window running Topspin, and close it using the [X] button on the top right.This will terminate any ongoing acquisition without warning, so use with caution.

Desktop Not Responsive

Any of the options below will terminate an ongoing acquisition without warning, so use with caution !!!

  • [Ctrl]-[Alt]-[Backspace] to force a logout
  • [Ctrl]-[Alt]-[F2] gives  you a text login prompt. Login as root and use the adminstrator password listed on paper on the computer case.  Then type systemctl restart lightdm to restart the graphic server, or reboot to reboot the computer.
  • If the [Ctrl]-[Alt] sequence is not responsive, go to one of the workstations, log in, and open a terminal  window from the favorites section of the Start menu.  In the terminal, type ssh nmr500, log in remotely with your password, become administrator by typing su (use the administrator password listed on the 500 computer case), and type systemctl lightdm restart or reboot
  • If anything else fails, push and hold the power button on the computer to force a power off, then turn it back on.

No connection to the spectrometer

After a power glitch or power outage, the spectrometer computer may need to reboot or the console  will shut off.  Topspin will give you messages like “Cannot connect to CCU” or similar.

  • Type ii restartIf the spectrometer is still running, it will restart the spectrometer computer and re initialize various components.  You may need to exit and restart topspin to complete the process.
  • If there was a power outage, the computer will come back on, but the spectrometer will remain shut off.  In that case, you have to push the green  ON button on the top left of the console rack to turn it back on.  Wait a couple of minutes, then  restart Topspin and type ii restartYou also need to turn the temperature regulation on by right click on the sample Temperature status display on the bottom of the Topspin window and selecting [Toggle VTU State (on/off)].
  • If the cryoprobe shut off or warmed up, you need to initiate a cool down.  Check the Prodigy Monitor on the bottom status display.  If it does not say Cold, click the  icon in the tool bar.  In the control window, select [Start Cooldown].  It may take several minutes to an hour for the probe to cool back down, depending on the length of the outage.

Manualy Setting up 2D experiments

The procedure for running two dimensional spectra follows in general the procedure for one dimensional experiments with some modifications.

Preparatory experiments

It is recommended to always take a proton spectrum to verify sample purity, assess concentration and later use to optimize spectral window.

A one dimensional carbon spectrum can also be useful, but not essential and may not always be feasible.

It is easiest if the 1D experiments are stored under the same name as the 2D experiments.

Select experiment

During creation of dataset, select the 2D experiment of choice. Predefined parameter files exist  for most common two dimensional experiments:

  • 1H/1H experiments:cosy, dqfcosy, tocsy, noesy, roesy
  • 1H/13C experiments:c13hsqc, c13hsqced, c13hmbc, c13adequate, c13hsqctocsy
  • other nuclei: n15hsqc, n15hmbc,si29hmbc

Setting up an experiment usually involves defining 1D proton and heteronuclear experiment (if available) for projection, optimizing the specral width in both dimensions, and  adjusting the duration of the experiment for sign al to noise and sensitivity.

Tuning/Matching

Proper tuning/matching of the probe is usually required.  It needs to be performed only once for each sample, but for all nuclei used in the experiment (1H and C13 for HSQC.

Turn rotation OFF

Spinning a sample can improve the line width, but also introduces diffusion and instability into the sample.  2 D experiments are typically run without sample rotation:

Type ro off on the command line or select from [Spin] menu:

Interactive optimization of spectral width

This procedure uses existing 1D proton (and carbon if applicable) spectra to interactively set spectral windows.   The spectra will also be added as 1D projection for plotting.

  • Select [Set Limits] from the Acquire flow bar.  A text box with step by step instructions will appear

  • Call up the 1D proton spectrum.  If you stored it with the same dataset name, just read the respective experiment number using the command line, i.e. re 1
  • You can also use the browser or the data history

  • Zoom the region you want to acquire in the 2D spectrum, then click [Ok] in the instructions dialog.  The software will automatically select the proper dimension.

  • Repeat the process for carbon (or other hetero nucleus) if applicable.

Manually setting spectral width

If no 1D spectrum is available, you can manually set spectral window parameters by typing o1p (offset in ppm) and sw (spectral width) at the command line.  The parameter for the acquisition dimension (horizontal, typically 1H) is on the left, the indirect dimension (vertical, can be 1H, carbon or other X nucleus) is on the right.

  • Setting o1p in the indirect dimension for a HSQC will also set the dependent parameter o2p
  • Toe achieve a window leftppm to rightppm you need to set you need to set sw = leftppm – rightppm and o1prightppm + sw/2

Setting experiment time

Default parameters for number of scans (ns) and number of individual spectra (1td) work for most samples. If  your sample is dilute or you need extra resolution in the indirect dimension, you may need to extend the experiment time.

  • ns increases the number of scans per spectrum.  That will increase signal to noise, but not change the resolution in the indirect dimension
  • 1 td will increase the total number of experiments done for the 2D.  This will typically improve both resolution and signal to noise
  • When typing td, only change number of points in the indirect dimenstion (f1, right value)


1D NOE Experiments

The NOE (Nuclear Overhauser Effect)  experiment allows for the estimation of through space proton-proton distances. The two dimensional version will capture all possible pairs of protons, but can be lengthy and lack resolution.

A one dimensional version of the experiment allows to obtain a set of distances to a selected proton in shorter time and full resolution of a normal proton spectrum.  However, setup of a spectrum requires knowledge of desired shifts from a previous proton spectrum.

On the Avance-500, the parameter set noe1d can be used for 1D NOE.

AUTOMATION

The setup assumes that you already took a 1D proton spectrum and know the ppm values of the signals you want to irradiate.  For a procedure where you interactively select several signals from an existing spectrum see the manual setup below.

  • Select noe1d as experiment from the pull down menu
  • In the parameter section (=) set cnst21 to the ppm value of the signal you want to irradiate.
  • Change o1p and sw if required.  IF the sample is dilute, you may need to increase ns.  For macromolecules (polypeptides, polymers) you may need to decrease the mixing time d8 to a smaller number (0.2s).
  • Repeat for as many signals you want to irradiate

In the final spectrum, the irradiated signal is the largest peak.   apk usually  phases that peak positive, but one needs to think of that peak as an inverted (negative) signal.  Hence negative NOEs will show as positive signals, and positive NOEs as negative signals.

MANUAL Setup

  • Using the noe1d parameter file

In manual setup, the parameter set noe1d can be used the same way as in automation by entering the ppm value of the signal to be irradiated.

  • Using the Topspin builtin interactive setup.

The Topspin builtin interactive setup may be more user friendly, in particular if you want to irradiate multiple signals.

In the [Acquire]  flow bar, select [Setup 1D Epts.] from the [More] pulldown menu at the right:

A new flowbar will appear.  Select “Define Regions” first.

This will enter the integrations mode.  You now need to define integral regions for each signal you want to irradiate.  The width of the integral will correspond to the selectivity of the irradiation.

If you had integrals in the spectrum before (manually of from abs), you need to delete them first.  First, select all integrals

Then, click the “Delete Selected” button

Now integrate only the signals to be irradiated as described in the basic NMR manual.

When done, select Save As and select Save Regions to ‘reg’ option

Now you are ready to click on [Create Datasets] in the 1D Selective Experiment Setup flowchart.

Select “Selective Gradient NOESY” from the pulldown menu.  For ROESY or TOCSY, select the respective gradient selective experiment.

You will be prompted to change any parameters if required.  Continue with [Accept]

Start the experiment(s) with [OK]. Selecting [Cancel] will create the datasets for you to run manually at a later time.

Click the <-Back button to exit the selective Experiment Toolbar.


NMR without deuterated Solvents

Deuterated solvent.typically used in NMR play several roles:

  • Reducing Solvent signal, that otherwise may overwhelm sample signals
  • internal calibration of ppm axis using shift of solvent signal
  • Long term stability of field using deuterium Lock
  • The topshim automatic shimming uses the deuterium signal of the solvent by default.

For samples with sufficient concentration regular solvents can be used, but the default procedure needs to be modified.

Automation

Running no-D spectra in automation is very straightforward.  There are only two things to consider:

When selecting the solvent, chose the protonated version instead of the deuterated: For example, H2O instead of D2O, DMSO-H6 instead of DMSO, CH3OH instead of MeOD.  This will autamatically do the following:

  • Skip locking on a solvent (Turn off the lock)
  • Use a topshim macro customized for proton without lock

Make sure that automatic calibration got a reasonable result, and manually calibrate using the solvent signal if necessary as described in the NMR long manual

Manual Operation

In manual mode, the following modifications to the standard procedure are necessary:

  • When creating the dataset, select the protonated version of your solvent off the list.  If you forget, type solvent to set it afterwards.

  • Type locknuc and set it to “OFF”
  • Skip locking on a solvent
  • Instead of clicking on [Shim] in the top flowbar, type lctshim on the command line or click on [No D shim] in the customized toolbar

  • Adjusting receiver gain is essential
  • Make sure that automatic calibration got a reasonable result, and manually calibrate using the solvent signal if necessary as described in the NMR long manual

Downloading Multiple Spectra from Website

on request I made it easier for users to download multiple selections from the Download App or the search result list of the Search and View App on the NMR lab website. I implemented the option to use the “SHIFT” key to select a block of consecutive entries.

  •   Click on the first checkbox in the series, then press and hold down the [SHIFT] key, and click the last checkbox in the series, then release the [SHIFT] button.
  •   It is possible for multiple blocks to be selected.
  •   Click the “Reset Selection” button to clear the selection.

There is currently one little bug/annoyance in the setup, and that is if you resort the listing after the page loaded (for example to sort by name instead of by date, you will need to click the “Reset Selection” button before making a block selection, even if there was nothing selected.  Otherwise the results can be unpredictable.

Note that zipping and downloading a large amount of data sets can be slow.  I have not tested how long it takes to zip and download huge amount of data, creating and downloading a several hundered MB or a few GB large file can take a while, and my App is at this point not giving much of time remaining estimates.

Also note, that downloads from the Download App get create a zip archive with the current directory (usually the data set name) at the root level, but downloading from the “Search and View” app will always be with the full directory tree (like /nmr500/data/user/nmr/datasetname/… as the result can contain files from different directory trees.

Exporting NMR data to Text

There are two commands available for exporting NMR data as ASCII text that can then be imported into spreadsheets or other software (Excel, Origin, Matlab, etc).

  • The Topspin build in command totxt will export in the JCAMP-DX standard format,
  • A customized au program toxy that I wrote will yield simpe x,y data..

JCAMP-DX

The Topspin command totxt is available natively in Topspin and can be run on any computer.  You can invoke it from the command line by typing “totxt” or from the File menu (top left) selecting [Save As]

and then selecting “Save data of currently displayed region in a text file”

You will be prompted a dialog with filename (default dataset_name.txt), directory (default is home directory, and there is no option to browse), Archive Type (use default) and weather to include imaginary data (RSPECT+ISPECT).   If you save several experiment numbers of the same data set, you need to include the number in your file name.  On the Spectrometer or the NMR lab workstations, I recommend saving in your Document directory (/home/user/Documents) as files in that directory can be downloaded from the website.

The result will be a file with a header listing left and right limit (taken as displayed on screen) and number of exported points, followed by a column of intensity values.  It will not generate a column of corresponding ppm values.  If you need the data as xy pairs (ppm and intensity), you need to either generate the ppm values in your spreadsheet using the header information or use my customized au program toxy (below).

X,Y Text file

The customized au program toxy is executed by typing toxy from the command line.   You will  be prompted for a filename, the default is datasetname_expno.  The program will first call the Bruker totxt command, and then convert the output file into a file filename.xy.txt with ppm,intensity pairs.  As the conversion part utilizes a unix based script, that command will only work on the 500 spectrometer or the workstations in B-10.  It will output the file into your Documents directory, which is a network directory that is available for download off the website.

Holger