The Structure Elucidation module in Topspin allows software assisted assignment of organic molecules using two dimensional COSY, HSCQ and HMBC spectra. A thorough description of all features of the module is beyond the scope of this knowledge-base entry. Links to the full manual and videos demonstrating the usage are at the end of the article.
The module is included in the standard Topspin distribution. The program runs with the free academic license, but some features are only available with the full CMCse license. The department
Summary
- Automatic peak picking and creation of correlation table
- Manual editing or picking of Peaks from spectra or correlation table
- Management and overlay of multiple data sets and assignments
- Manual assignment of partial of full structure using fragment tool
- Automatic assignment of given structure (full license)
- Generation of target structures compatible with the spectra (full license)
- Ranking of structures based on 13C chemical shift
https://www.bruker.com/en/products-and-solutions/mr/nmr-software/cmc-se.html
Input Data
Essential Spectra
- 1D Proton. Preferably quantitative
- Edited C13-HSQC (regular HSQC will not get multiplicities right). You need to have CH/CH3 pointing up, CH2 down.
- HMBC
Other Spectra supported for Structure elucidation
- COSY. If you use dqfcosy, you need to process in magnitude mode (xf2m)
- 1D carbon
- 2D 15N-HSQC and 15N HMBC
- 13C ADEQUATE
Spectra supported for manual analysis
- NOESY/ROESY
- TOCSY, HSQC-TOCSY
Other
- Molecular Formular (required, can be changed during analysis)
- Known Fragments (from MS, knowledge about chemistry, or manual analysis)
Starting the Program
Ideally, all spectra are saved with the same data set name and different experiment numbers. That results in the easiest way to add the spectra to the project. Pull up one on the spectra on the screen, then open the CMCse module:
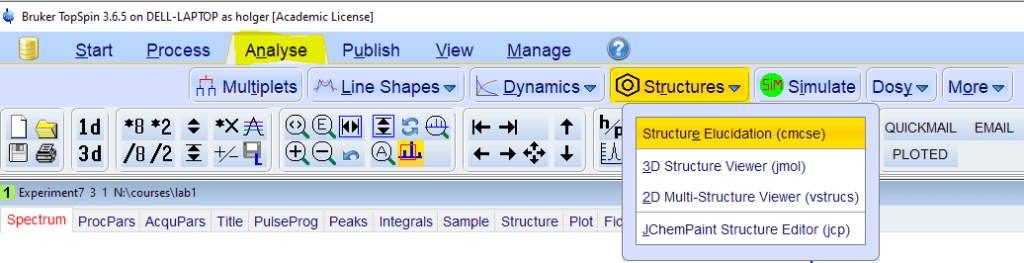
- On the command line, type cmcse
- From the [Analyse] toolbar, select [Structures]->[cmcse]
If you don’t have any recent projects, the [Create New Project] dialog will come up. If there are projects in your history, a list of recent projects will come up. Select one, or click the [New] button to create a new project.
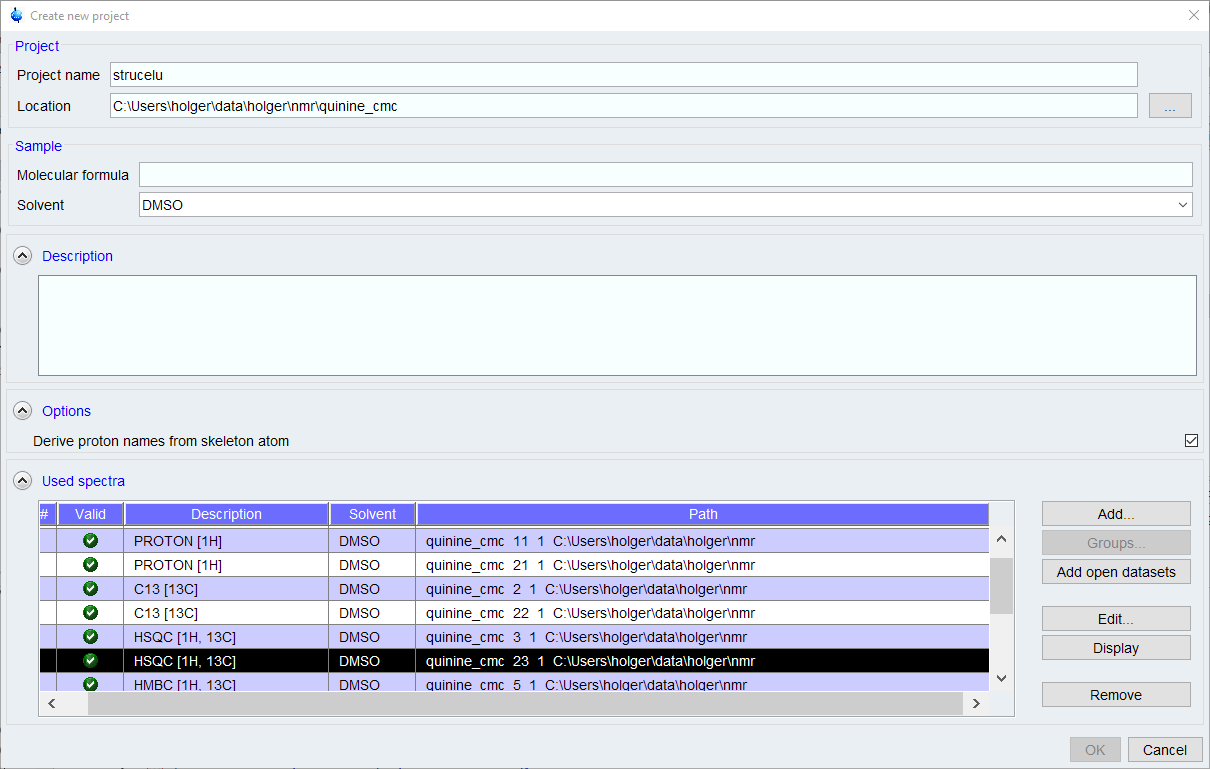
- A molecular formula is required. If you are not sure about the molecular formula, you can enter a first guess which can be changed later, but many automated functions like peak picking and assignment will not work properly without a correct MF.
- The list of spectra will be populated with all spectra from the current data set name. Other spectra can be added using the [Add] button, but the search function used is somewhat clumsy to use.
- Remove any spectra you don’t want to be used of that are duplicates.
- Click [OK] to proceed
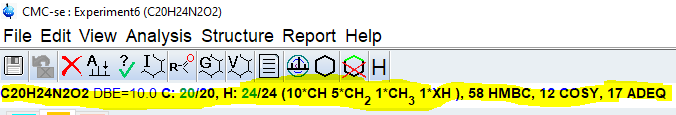
There will be two windows. The Topspin window will display the spectrum overlays, the new CMC-se window the correlation table, the structure window and the menu for program control.
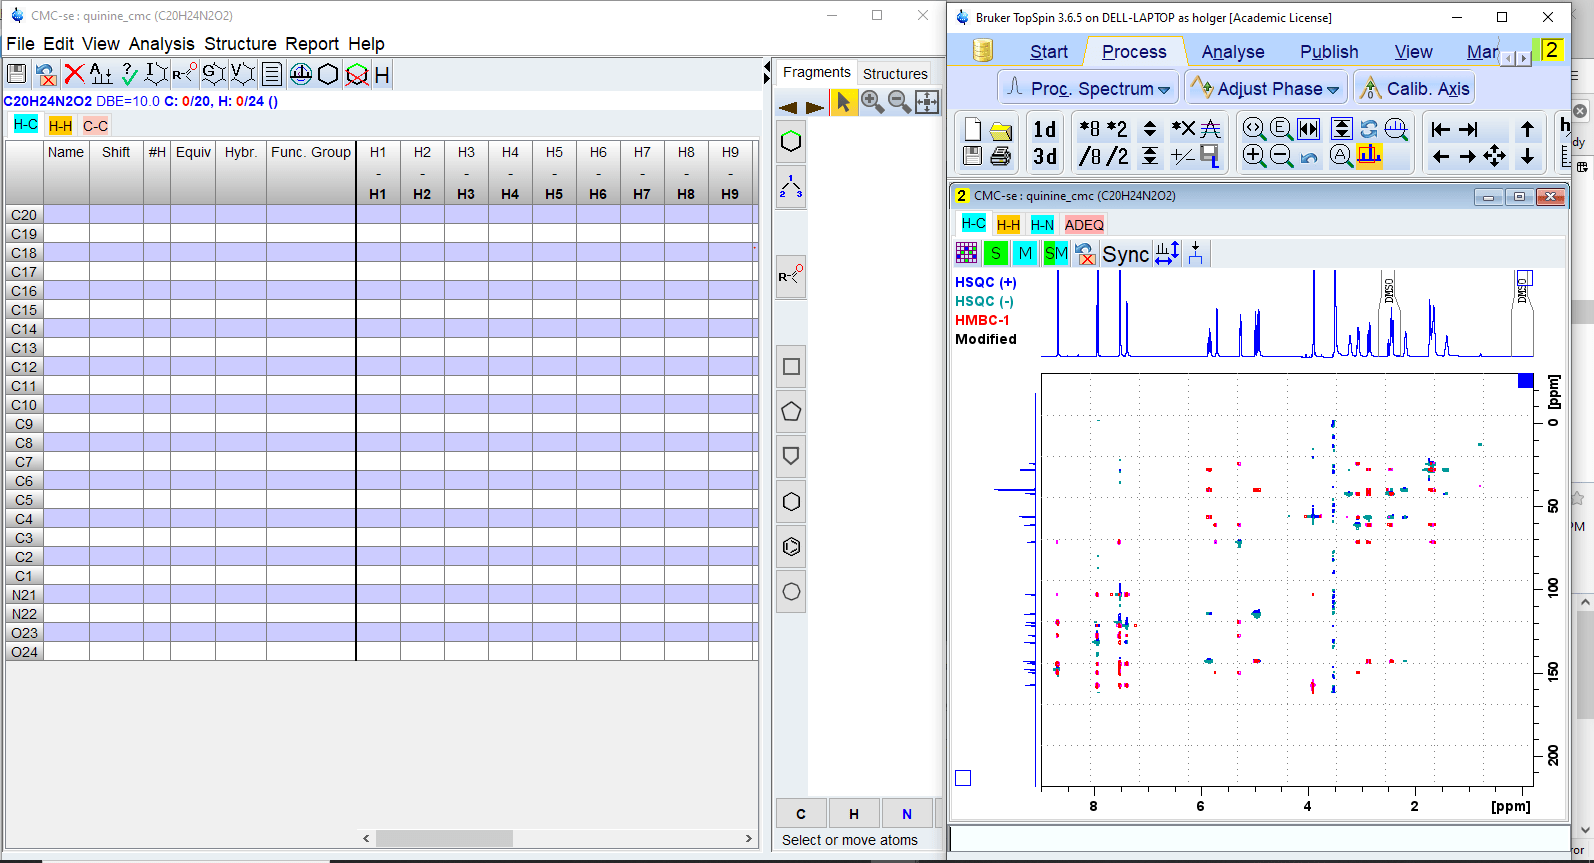
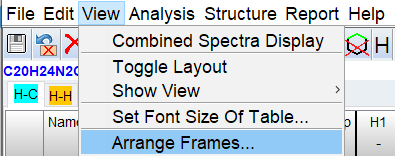
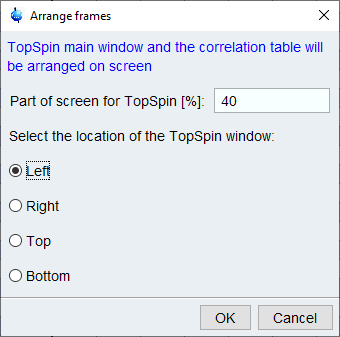
The windows can be arranged using the Arrange Frames dialog.
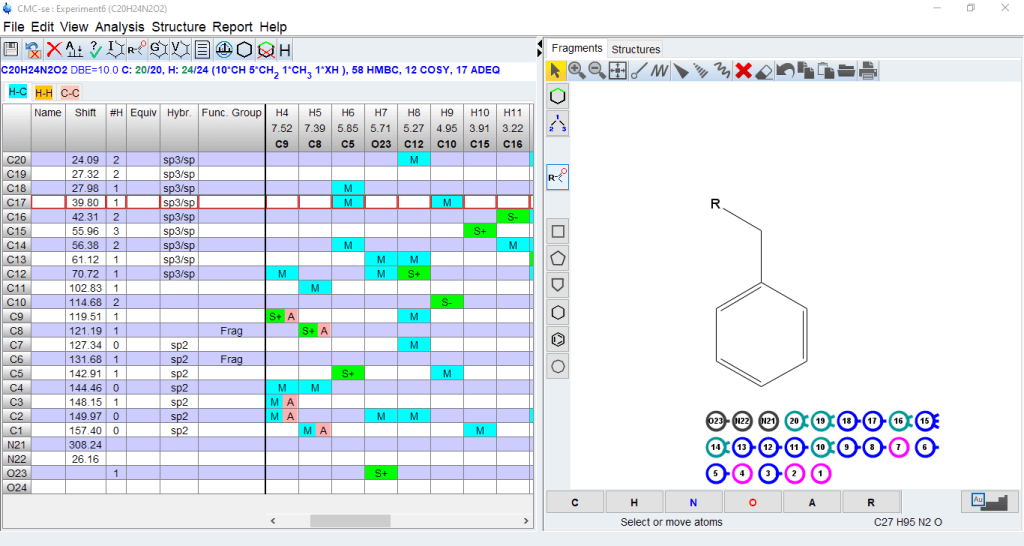
Picking Peaks
Select [Start Automatic Spectrum Analysis] from [Analysis] menu. This will perform an automatic peak picking of all 2D spectra selected and build a correlation table based on the molecular formula.
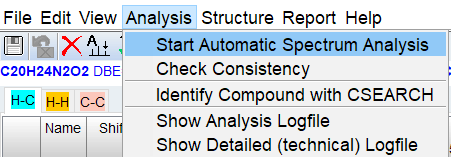
Check the consistency report for problems and check the line below the top menu for found fragments and the correct number of protons and carbons. Missing carbons or protons will be highlighted in red.

In many cases, there will be problems that need to be corrected before one can proceed with any of the automated assignment or structure generation routines. The details of manual editing/checking can vary but should include the following:
- Removing correlations from the spectrum or correlation table
- Adding correlations to a spectrum or correlation table (right click on a cell in the table, select “Add multiplets manually” from the spectrum display or right click on the spectrum and select “Define Multiplet”. .

- Check the #H and Equiv columns in the correlation table to ensure correct multiplicity of the carbon and correct symmetry (in a phenyl group, ortho and meta CH would have Equiv=2)
- Sometimes you need to remove an atom from the correlation table: Right click on atom name (left column) and select Clear all Atom Information
- If you are not sure about the molecular formula or there are considerable impurities in the spectrum, you can skip Automatic Analysis and pick all signals manually.
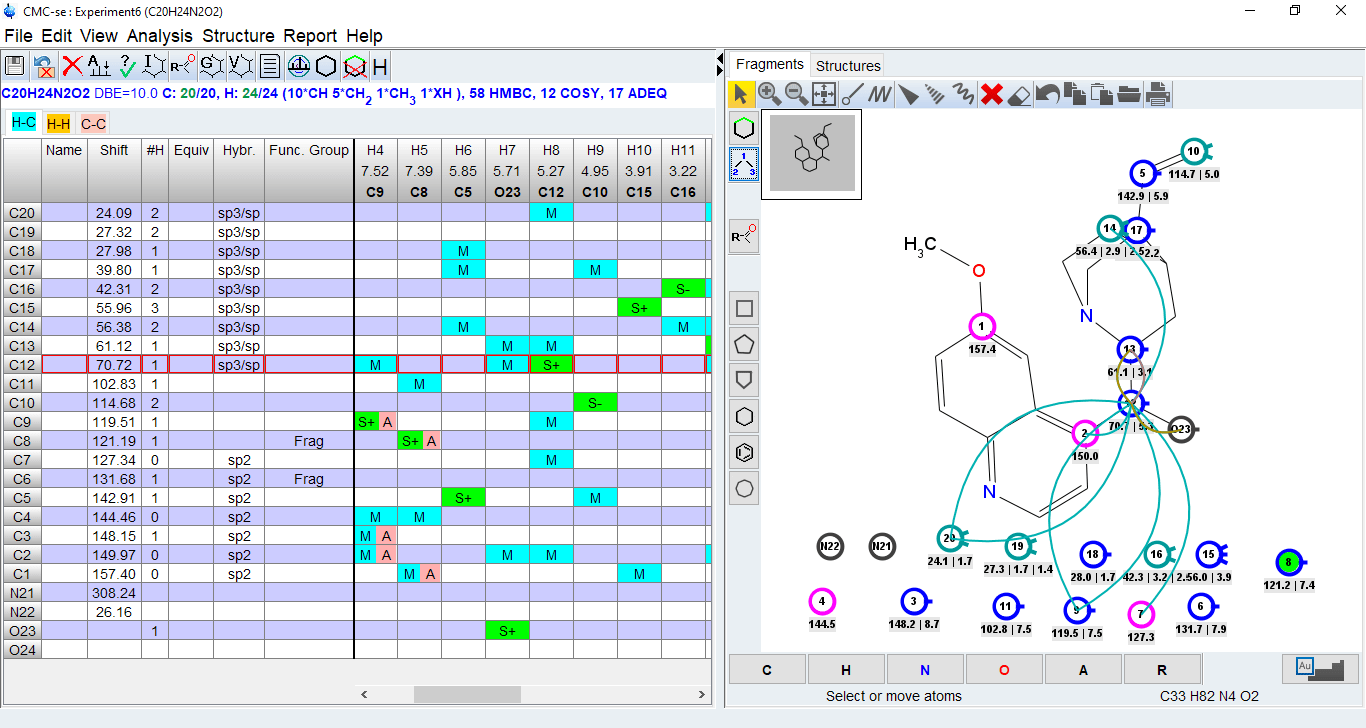
Manual Assignment
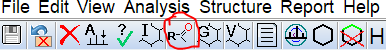
Open the Fragment tool by clicking on the ![]() icon in the top menu bar if it is not already open.
icon in the top menu bar if it is not already open.
The Structure/Fragments window will open on the right of the CMC-se window. The size of the window can be adjusted. The window will show balls for the building block fragments (C,CH,CH2,CH3) generated by automatic or manual analysis of the spectra
Within the fragment tool, you can do the following:
- Draw a complete or partial structure using the drawing tools
- Add a pre-defined fragment using the template button
 on the left menu bar
 - Upload an existing structure file in MDL .mol format
- Clicking on the building blocks will show the correlations (COSY,HMBC) connecting that block with others
- You can use the drawing tool to connect blocks with a bond or you can drag those blocks into a partial or completer structure using the displayed correlations as a guide.
- Identify wrong or long range assignments from the correlation table
- Clicking on an assigned atom will highlight the correlations in the correlation table
- Clicking on a correlation in the table will display the correlation in the structure
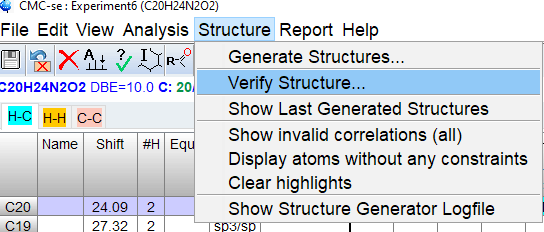
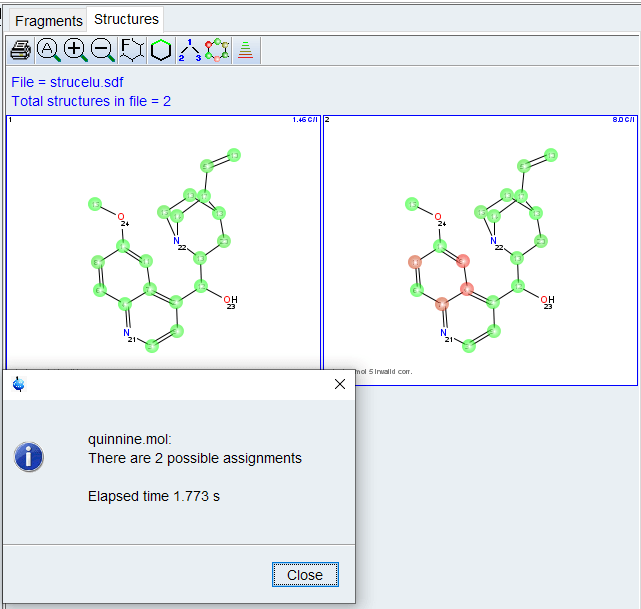
Automated Assignment (full CMC-se license required)
From the top menu, select [Structure]->[Verify Structure…] and select [File on Disk] from dialog. Click [OK] and browse to the mol file with your structure.
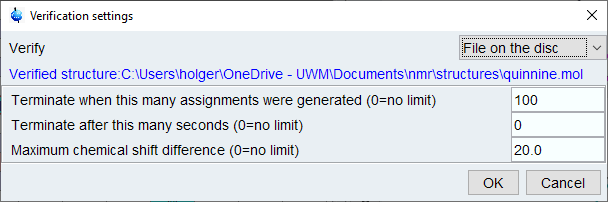
After a few seconds, the Structures window will pop up displaying possible assignments, ranked by predicted C-13 shift will be displayed. The Highlight Correlations function ![]() should be used to display invalid correlations. Implausible correlations should be checked for possible overlap,wrong assignment or weak intensity in the correlation table/spectrum.
should be used to display invalid correlations. Implausible correlations should be checked for possible overlap,wrong assignment or weak intensity in the correlation table/spectrum.
Structure Generation (full CMC-se license required)
If no target structure is known (natural product or unexpected reaction), or alternate possible structures are to be checked for, the [Structure]->[Generate Structures ] function can be used to generate all structures compatible with the given spectra. This is particular useful for drug discovery from natural products.

A dialog window will open up to set structure generation settings.

- Set allowed/required/forbidden ring sizes
- You can use fragments defined previously in the fragment tool to restrict possible structures
- Select which type of correlations to include. Including ADEQUATE can greatly reduce the number of possible structures.
- Important: Allow for a sufficient number of correlations to be long range. The maximum number of eliminated correlations may need to be tweaked to get structures. Violated correlations need to be checked in the final structure, and the spectra should be checked for wrong assignment or particularly weak correlations. Those should be corrected or eliminated.
- Set chemistry rules. Some groups (peroxides, nitro) are not tried by default.
- Click [Generate Structures] to begin. Depending on the settings, this can take a while. If no structures are found, increase number of eliminated correlations or check peak tabl for wrong or ambiguous assignments.
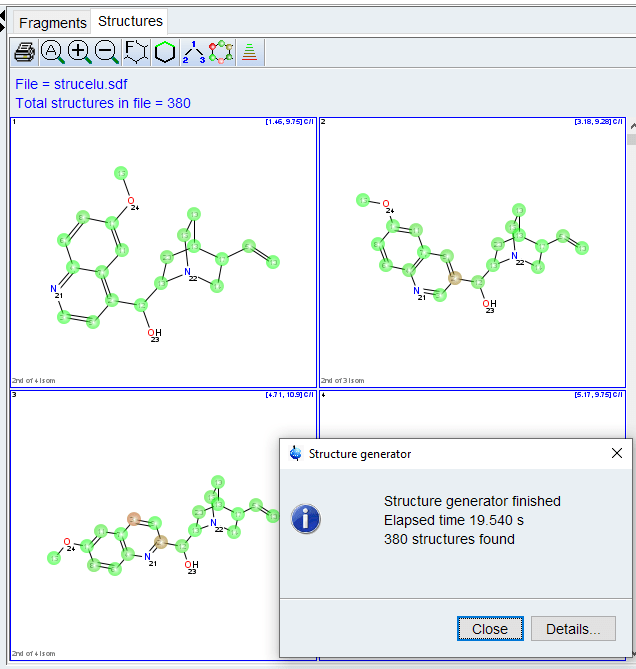
The structures will be ranked by agreement with predicted carbon chemical shifts. Valid or invalid correlations can be displayed using the “Highlight Correlations” tool ![]() . Clicking on a correlation in the spectrum or correlation table will also display that correlation in the structure.
. Clicking on a correlation in the spectrum or correlation table will also display that correlation in the structure.
Generate Report
A final report in pdf format can be created. That report will list the selected structure, the assigned proton and carbon shifts as tables and annotated spectra, and correlation of predicted and observed chemical shifts.

Further Resources
The full official documentation on the module can be accessed by selecting [Help]->[Structure Elucidation Manual] from the top menu in the CMC-se window, or it can be downloaded from the link below:
Bruker CMCse Documentation in PDF (From NMR Lab website)
Slides from Bruker Webinar (From NMR Lab website)
Videos demonstrating the usage of the module:
Video of data analysis using CMCse by Frank H Foersterling