Direct reconstruction of the surface electron density from a model of the O/Cu(104) surface
R. Harder and D. K. Saldin
In collaboration with Prof. I. Robinson of the University of Illinois at Urbana-Champaign
Data simulation by the ROD program of Dr. Elias Vlieg
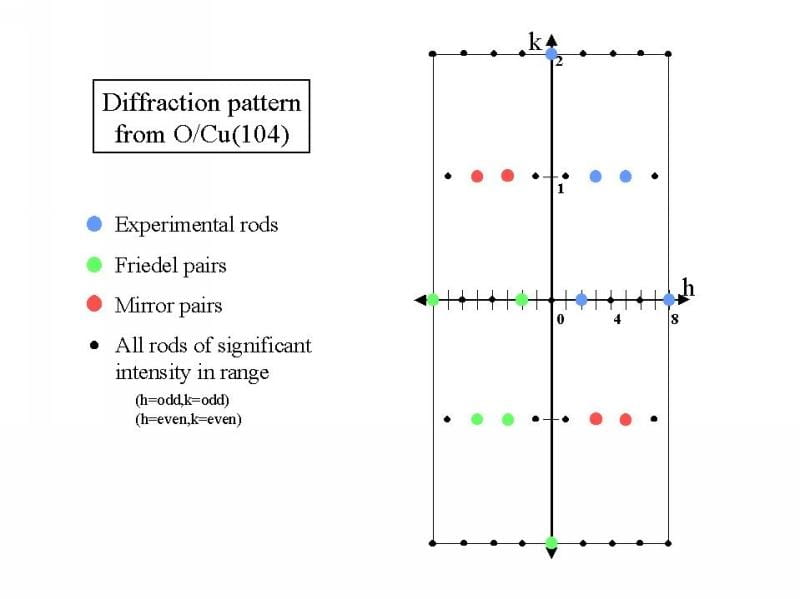 |
Schematic of the diffraction pattern from O/Cu(104). The dots represent projections of all of the reciprocal-space rods whose calculated intensities are used as input to the algorithm. The blue spots represent the rods whose intensities were measured by Robinson and co-workers. The other colored spots denote rods whose intensities may be inferred by Friedel’s Law and mirror symmetry about the h axis. |
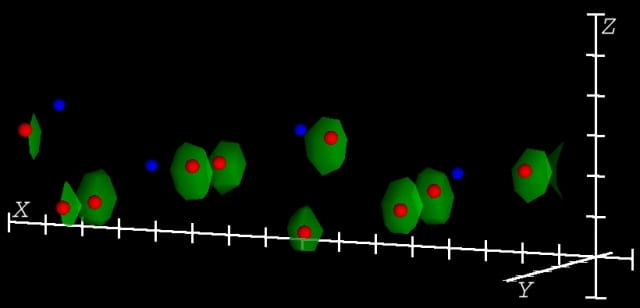 |
Starting point of the direct algorithm: essentially the bulk-terminated structure of O/Cu(104). The red dots mark the positions of the substrate Cu atoms, and the blue dots those of the O atoms in the assumed structure. Isosurfaces of electron density are denoted in green in this 3D perspective view of the surface. Note that although the electron density of the Cu atoms is reproduced well there is initially no indication of the O adsorbates. |
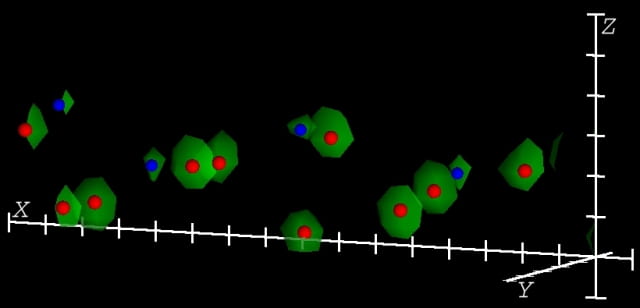 |
Similar perspective view of the final electron density reconstructed by our algorithm from the calculated intensities of all the rods (black and well as colored) depicted in the schematic diffraction pattern above. New electron density lobes are now seen to have developed around the O atom poistions. Also, the electron density lobes around the substrate atoms seem to be better centered around their positions in the reconstructed substrate. |
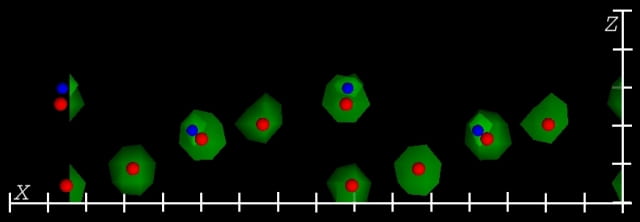 |
Side elevation of final electron density. |
 |
Plan view (from above the surface) of the final electron density. |