The first image below is the result from our algorithm on simulated data at l=.01.

Shown below is the projected electron density using the experimental data at l=.01 for different scaling factors. The scaling factor doesn’t seem to have much effect on the results over a reasonable range. The extra oxygens that I had considered in the previous results appear to have been due to the scaling, however.
Scale = .40

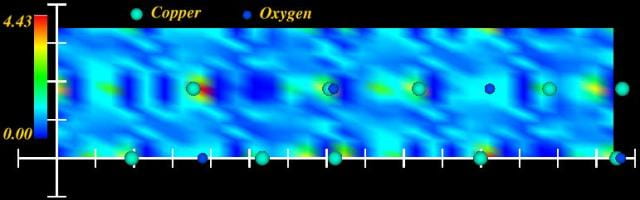
Below is the same result as above, except I have made the projected density slightly transparent so that the bulk copper can be seen as represented by the smaller green spheres. It occurred to us that the extra features (circled in yellow) in the density could be additional reconstructed copper atoms from further into the bulk. These features could also be caused by improper scaling of the ulk amplitudes although the fact that they appear regardless of the scaling makes them seem more real.
![]()
Here is a perspective view showing some of the bulk atoms.

An r-factor comparison of the model with the data as a function of just the scale factor gave Scale=.365 as the optimal. Our algorithm gave virtually the same result
as scale=.4 when run with this scale.
Here are a couple more results with different scale factors.
Scale=.25
Scale=.70