More Acid Rain Info
The web sites listed below offer abundant information on many different aspects of acid rain.
- Environment Canada sites:
- www.ec.gc.ca/acidrain/
www.ns.ec.gc.ca/msc/as/as_acid.html - ThinkQuest Acid Rain entry:
- http://library.thinkquest.org/26026/Environmental_Problems/acid_rain.html
- Encyclopedia of the Atmospheric Environment:
- www.doc.mmu.ac.uk/aric/eae/english.html
- U.S. Environmental Protection Agency acid rain site:
- www.epa.gov/airmarkets/acidrain/
In Spanish: http://www.epa.gov/acidrain/enespanol/index_espanol.html - Norwegian Pollution Control Authority acid rain site:
- http://odin.dep.no/md/html/acid/AcidRainE.html
- U.S. National Park Service site:
- www2.nature.nps.gov/air//edu/Lessons/AcidRLessonPlan.htm
- U.S. National Acid Deposition Program site:
- http://nadp.sws.uiuc.edu/lib/
- Maine (U.S.) Department of Environmental Protection Acid Rain site:
- www.maine.gov/dep/air/acidrain/
- Hubbard Brook Ecosystem Study site:
- http://www.hubbardbrook.org/education/Introduction/Intro13.htm
- U.S. Geological Survey site on Acid Rain and our Nation’s Capitol:
- http://pubs.usgs.gov/gip/acidrain/
Meteorological Data
The following tables provide links to the weather charts you will need to complete this project. On the charts, time is given in units of “UTC” or “Z”. Click here for instructions on how to convert from Coordinated Universal Time to local time and to get information about each type of weather chart.
- Trajectory of air arriving at El Tajín on December 6, 2002, 0000 UTC
(one image available) - get chart
- Precipitation during the 6-hour period ending at 0000 UTC on December 6, 2002
(one image available) - get chart
| Infrared satellite images | At trajectory arrival time (December 6 2002, 0000 UTC) | 0.5 days before trajectory arrival (December 5 2002, 1200 UTC) | 1 day before trajectory arrival (December 5 2002, 0000 UTC) | 1.5 days before trajectory arrival (December 4 2002, 1200 UTC) | 2 days before trajectory arrival (December 4 2002, 0000 UTC) |
| (five images available) | get chart | get chart | get chart | get chart | get chart |
Geographic Maps
Click on these links for maps that will help you describe which cities or areas may have contributed pollution to El Tajín’s rain.
| United States: | USA states | Texas | Arizona | New Mexico |
| Mexico: | Mexico states | Veracruz | Nueva Leon | Tamaulipas |
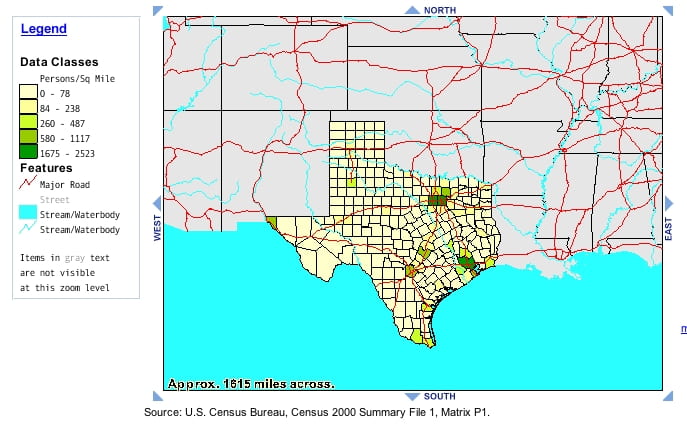
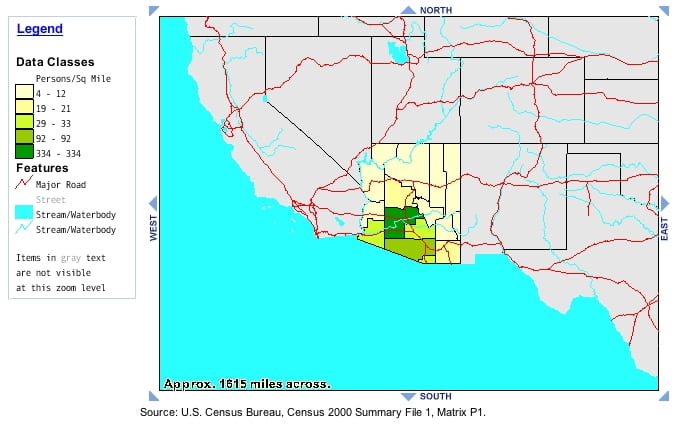
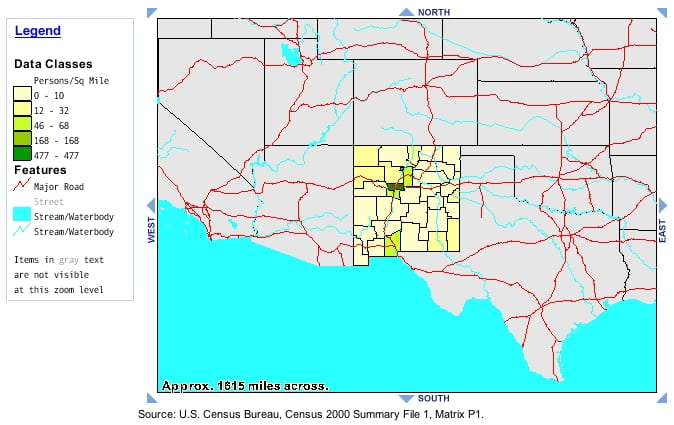
Population Data
These links will give you an idea of the population of some areas in Mexico and the southern United States.
- United States:
- Texas population density (number of people per square mile)
Arizona population density (number of people per square mile)
New Mexico population density (number of people per square mile) - Mexico:
- population of largest cities
Other Sources of Meteorological Data
If you’re interested in looking at more meteorological charts, perhaps for other locations or for other dates, here are some good places to find them.