Coordinated Universal Time
Coordinated Universal Time (UTC), Greenwich Mean Time (GMT) and Zulu time (Z) are all the same thing: the time along the Prime Meridian (0 degree longitude) which passes through Greenwich, England. It is the standard time used in the fields of astronomy, meteorology and other scientific disciplines around the world. UTC (or GMT or Z) became a world time standard because it was used by Britain’s Royal Navy and merchant fleet during the nineteenth century.
You can use the following chart to convert from UTC to your local time zone.
Trajectory Chart
The upper portion of the chart (the part with a map of Mexico and a portion of the southern United States) shows the pathway that air followed through the atmosphere as it made it’s way to the El Tajín archaeological site, arriving at 0000 UTC on December 6, 2002. The location of El Tajín is marked with a black star. Time intervals along the triangle are indicated by triangles: small triangles are drawn every 6 hours, and large triangles are drawn every 24 hours. These time indicators tell you, for example, that the air crossed the US-Mexico border 18 hours before arriving at El Tajín. The bottom graph shows the altitude (in meters above ground level) of this particular mass of air as it followed the winds to El Tajín.
Precipitation Chart
The shaded areas of the chart show where precipitation occurred in the 6 hour period ending at 0000 UTC on December 6, 2002. The unit of precipitation is millimeters.
Infrared Satellite Image Charts
Infrared satellite images shows the location and altitude of clouds. Technically, infrared images show temperatures of the tops of clouds, but this tells us where the clouds are located. These images also show the altitude of the clouds by utilizing two basic scientific principles: (1) all objects give off heat, also called infrared radiation, and (2) the atmosphere cools as you increase in altitude. This tells us that colder clouds are located at higher altitudes, and warmer clouds are at lower altitudes.
Here’s how to read an infrared satellite image. Cloud location: look for areas of white. Cloud altitude: look for areas of brighter white. Tall thunderstorm clouds will show up as bright white, while low stratus clouds or fog will loom much darker.
 |
| In this image you can see high-altitude clouds, low-altitude clouds, and areas of clear skies. |
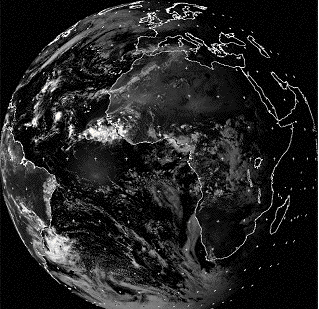
An advantage that infrared satellite images have over visible images, another type of satellite image used frequently by meteorologists, is that you can view it 24 hours a day. Look at the images below and see if you can figure out why one of them shows clouds off the east coast of Africa, and the other one doesn’t.
 |
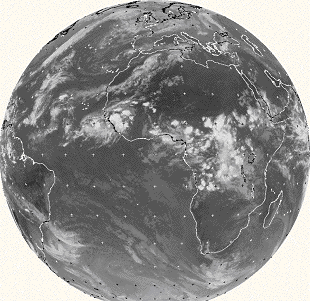 |
| Visible satellite image over Africa. | Infrared satellite image over Africa. |