Quick Index
- I am not receiving any of my students’ emails. For now, I am having them print out hard copies. Please let me know if this is something that can be corrected.
- How much of a problem is it to assess the forecasts of let’s say 60 students. I would think that you would need to view the weather patterns associated with each assigned location to verify the reasoning that the students give for their forecasts.
- How do I prevent my computer literate students from going online and getting the forecast for the suggested locations?
- Can I get the suggested rubric for the grading of predictions? I know it was in the original article but I haven’t been able to open that site again.
- What do you suggest the students understand (or at least have covered in class) before they attempt such an exercise??
- I tried your web site…but I’m afraid I did not understand how to access pertinent information for the city in question via the site. I went to “The Virtual Map Room” but it was providing data for WI not Alaska (Juneau being the next city on your list)….am I just being a neophyte and missing something obvious???
- Let’s say I give this assignment as a partner or small group activity for 175 students. Would I then get about 50 to 80 forecasts from my students and the same number of replies from you?
- Can students make their forecasts on a day other than Tuesday? (All of the forecast days are listed as Wednesdays.)
- We are concerned that the students not have direct access to the e-mail addresses of the teachers; it appears that you have built this security factor into your programme.
- I want our school weather station data to load to our school web site and was wondering if there is an easy way??
- Do you have records of the wind direction for each city because it is not listed on the Weather Underground pages you have linked under “Verification”?
- Jon, I must be very dense here, but I think I need a little information before I try this activity out and then assign it to my students. Do I understand that they choose a place–it must be one on the list?–and then they make a forecast using the appropriate data and submit it.
- Anything else I need to tell my students? Is there a web site you have that would give them a little background or tutorial as they are making up their forecast? It sounds great, just want to make sure they understand (me, too).
- How can I get verification of forecasts made for international cities?
- Why do different surface maps (for example the one that comes up when you view the Virtual Weather Map Room and surface map #5) sometimes show different things? Today my students pointed out that the current map showed a warm front while map #5 showed a cold front.
I am not receiving any of my students’ emails. For now, I am having them print out hard copies. Please let me know if this is something that can be corrected.
Try checking your spam folder. Sometimes the email messages generated by the forecasting system are incorrectly identified as spam.
Return to index
How much of a problem is it to assess the forecasts of let’s say 60 students. I would think that you would need to view the weather patterns associated with each assigned location to verify the reasoning that the students give for their forecasts.
Depends on what you want to assess. If you wanted to assess the accuracy of their forecasts, you could use simple statistics like average relative or absolute errors. (You can see simple explanations of these here, scroll down to “Finding the Average Relative Forecast Error” and “Finding the Average Absolute Forecast Error”). However, assessing the accuracy of the forecast may not be what you’re looking for.
In my introductory meteorology classes at UW-Milwaukee (which often have well over 60 students) I usually assess the justifications that go along with the forecasts. I figure the students are learning, so their forecasts may very well not be terribly accurate. Instead, I like to focus on their thought processes. I read their forecast justifications and ask myself: Are they paying attention to the correct meteorological considerations? Have they applied the concepts they learned in the classroom? Have they shown evidence that they examined current weather charts in order to make their forecasts? Of course, I examine the weather charts myself to familiarize myself with the meteorological scenario associated with the forecast. This need not be terribly complicated; I usually look at a map with fronts and pressure patterns, a temperature map, and a satellite cloud image.
Return to index
How do I prevent my computer literate students from going online and getting the forecast for the suggested locations?
Good point. You really can’t prevent your students from copying forecasts made by others and posting them instead of their own efforts. However, this is where the “justification” fields come in. Each of the four forecast elements has a justification field which must be filled in. You can use this information to assess the students’ thought processes that guided their forecast. I think it’s likely that inconsistencies between the forecasts and the justifications might exist in plagiarized forecasts, making it easy to identify them.
Return to index
Can I get the suggested rubric for the grading of predictions? I know it was in the original article but I haven’t been able to open that site again.
The rubric I had described was the following (excerted from the article):
***
In this section the results of the Internet weather forecasting system used in a large UW-Milwaukee introductory meteorology course are presented. The Fcourse, entitled ‘Survey of Meteorology’, satisfies a general education requirement and has no prerequisites of any kind. From January – May, 1999, weekly forecasts were submitted by 160 students, 50% of whom were freshmen and soophomores. None of the students were meteorology majors.
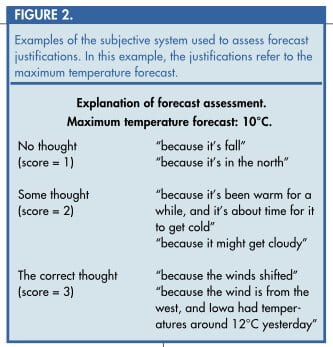
The students’ forecast justifications were assessed and assigned scores according to the following system:
1 = No thought
2 = Some thought
3 = The right thought
Examples ofthis subjective scoring system are shown in the figure below. A score of 1 (‘No thought’) indicated that the student had, in making his or her forecast, utilized essentially none of the concepts presented in the class. A score of 2 (‘Some thought’) indicated a genuine attempt to incorporate relevant meteorological considerations into the forecast, however these considerations were relatively unsophisticated or shot wide of the mark. A score of 3 (‘The right thought’) was awarded if the student’s justification included some of the meteorological concepts relevant to that particular day’s weather.
***
This rubric was developed as a means for evaluating the effectiveness of the weather forecasting activity. I think it was appropriate for that purpose. However, you may very well think of a different rubric that would be better suited for your students, and for the specific way in which you’re using the forecasting activity.
Return to index
What do you suggest the students understand (or at least have covered in class) before they attempt such an exercise??
I’d suggest that they be able to read a temperature map (for example http://weather.unisys.com/surface/sfc_con_temp_na.html), and a surface wind/pressure map (for example http://weather.unisys.com/satellite/sat_sfc_map.gif). Explanations of map symbols can be found at http://weather.unisys.com/surface/details.html.
Students can make forecasts using this information, along with a bit of common sense, even before starting a structured curriculum unit on meteorology.
Return to index
I tried your web site…but I’m afraid I did not understand how to access pertinent information for the city in question via the site. I went to “The Virtual Map Room” but it was providing data for WI not Alaska (Juneau being the next city on your list)….am I just being a neophyte and missing something obvious??
Some (but not all!) of the maps on the Virtual Weather Map Room web site are focused on the continental United States, so I can understand why you’re confused about how to gather weather information for an Alaska forecast. Please be aware that my list of forecast sites is just a suggestion, and that your class can certainly forecast for any location you choose.
Return to index
Let’s say I give this assignment as a partner or small group activity for 175 students. Would I then get about 50 to 80 forecasts from my students and the same number of replies from you?
Each group would make a weather forecast using the Internet system. When they enter the forecast and click the ‘submit’ button, an email message containing the forecast gets sent to you. I don’t get a copy. You can assess the forecasts in a way that fits in with your curriculum. If 175 students make their forecasts in pairs, then you’ll have roughly 85 email forecasts to assess. One way to manage the barrage of emails would be to get a second email account, and use this new account for the forecasts (your tech coordinator at your school should be able to manage this).
Return to index
Can students make their forecasts on a day other than Tuesday? (All of the forecast days are listed as Wednesdays.)
Students can make their forecasts on any day, and for any location that the teacher chooses. The advantage of using the Wednesday forecast day (i.e., students make their forecasts on Tuesday) and the locations listed on the Suggested Forecast Sites and Verification web page, is that they can also use the verification link posted to that same web page. (The verification is the weather that actually occurred on the forecast day.)
If students make their forecasts on a different day, or for a different location, then they’ll need to gather their own verification data. One way to do this is:
- Go to the Weather Underground web site (www.wunderground.com) and enter the forecast location in the “Fast Forecast” box found at the top of the page. (As an example, try typing “Seattle, WA”.)
- Scroll down towards the bottom of the page to where it says “Historical Conditions”. Click on the “Go” button.
- When the new page loads, find the 4-character station code in the browser address bar. (In the Seattle example, the station code is KBFI.)
- The link for the verification on your forecast day is:
www.wunderground.com/history/airport/xxxx/yyyy/m/d/DailyHistory.html
where xxxx is the station code, yyyy is the year (i.e. 2002), m is the month (1 character for January – September, 2 characters for October – December), and d is the day (1 character for the first 9 days of the month, 2 characters thereafter).
We are concerned that the students not have direct access to the e-mail addresses of the teachers; it appears that you have built this security factor into your programme.
It’s not really built in. Once a student submits his or her forecast, a web page appears that contains the text of an email message that contains the forecast. This page includes the address to which the email was sent (the teacher’s email address). An attentive student could figure out the teacher’s email address from this web page.
If security is a problem, one possible solution might be for each teacher to get a new free email account, from hotmail or yahoo or wherever, and use it only for the forecasting activity.
Return to index
I want our school weather station data to load to our school web site and was wondering if there is an easy way??
There are many different programs which will transfer weather data from your school weather station and put it on a web page. These programs are generally quite inexpensive. A list of several good ones can be found here: www.wunderground.com/weatherstation/index.asp.
Return to index
Do you have records of the wind direction for each city because it is not listed on the Weather Underground pages you have linked under “Verification”?
You can verify the wind direction by following this procedure:
- Go to the National Weather Service’s interactive web site. You’ll see a map of the United States
- Click on the state you’re interested in. You’ll see a map of the state with several cities listed.
- Click on the city you want. When the new web page loads, scroll down and you’ll find the “24 Hour Summary”, with hour-by-hour weather conditions including wind speed, direction and precipitation.
Another way to find verification (the actual weather that occurred at a particular forecasting location):
Go to www.wunderground.com, type in the city name in the box at the top, and click the “Fast Forecast” box. When the forecast page comes up, scroll down to the “Historical Conditions” area and you can find the actual weather for any day in the past, as recent as yesterday.
Return to index
Jon, I must be very dense here, but I think I need a little information before I try this activity out and then assign it to my students. Do I understand that they choose a place–it must be one on the list?–and then they make a forecast using the appropriate data and submit it.
Obviously, a forecasting location must be chosen. You could use a common forecasting location for the whole class (sort of as a common denominator for the exercise), or different students could forecast for different places. You’re welcome to use the locations that I provide on my list, but you’re not tied to that. I find that it generally works best to forecast for locations that have some meaning to the students (locations where local sports teams are playing? locations where kids are planning vacations? locations that are relevant to other aspects of their studies?)
Return to index
Anything else I need to tell my students? Is there a web site you have that would give them a little background or tutorial as they are making up their forecast? It sounds great, just want to make sure they understand (me, too).
I have some suggestions for background material, however the forecasting activity is designed as a supplement to a meteorology unit, rather than as the unit itself. For suggested background materials, I can suggest:
- A book called The National Audubon Society First Field Guide to Weather, written by myself, published by Scholastic in 1998.
- There is a good (though not terribly detailed) online meteorology textbook published by the University of Illinois. You can find it at ww2010.atmos.uiuc.edu/(Gh)/home.rxml
How can I get verification of forecasts made for international cities?
You can get forecast verification (i.e., the weather that actually occurred) for most international cities at the Weather Underground (www.wunderground.com). When you visit the site, enter the city and country you’re looking for in the text box at the top of the page. When you get a page with the current weather conditions and forecast, there will usually be a section labeled “Historical Conditions”. In this section you can look up observed weather conditions during the past several years.
Return to index
Why do different surface maps (for example the one that comes up when you view the Virtual Weather Map Room and surface map #5) sometimes show different things? Today my students pointed out that the current map showed a warm front while map #5 showed a cold front.
Whenever you look at a weather chart, the first thing you should do (always!) is to check the date and time. Sometimes the maps aren’t updated properly, and if you’re not careful you could be comparing apples and oranges (evaluating maps corresponding to different date/times) when comparing more than one map.
Also, the frontal analysis (placement of fronts) on these maps is done by computer. They are by no means foolproof, and frontal placement is especially problematic in areas with weak temperature changes. The way to verify the placement of a front is to look at a temperature map (there are links to several on the Virtual Weather Map Room) and decide for yourself where the front belongs, i.e., along a boundary between warmer and colder air.
Return to index