Fluorescence Spectroscopy is a process which analyzes the wavelength of fluorescent light emitted from a sample. This technique has been used in biochemical, medical, and chemical research fields, and has been reported to aid in differentiating between malignant and benign tumors. The science of spectroscopy deals with the interaction of light with matter. The way that light transmits to, reflects from, refracts from, and is absorbed in the tissue provides information about structural and biochemical features of that tissue. When light interacts with tissue, different scenarios happen. A portion of the light is reflected from the surface which is called specular reflection. The other portion of light that penetrates in the tissue undergoes several events: some is absorbed, some is diffusely scattered and the rest excites fluorophores within the tissue, giving rise to fluorescence. This luminescence is detectable by spectroscopic technique. The randomly scattered light in the tissue emits from the surface as diffuse reflectance. This portion can be detected by reflectance spectroscopy. The depth of penetration depends on the wavelength of incident light, which is on the order of a hundred microns for UV and blue excitation wavelengths. As the wavelengths get longer, the depth of the penetration increases. 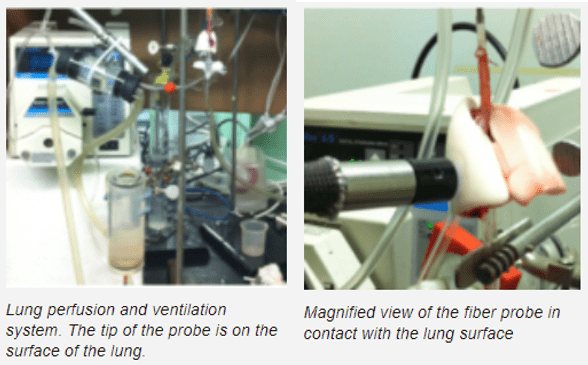
Biomedical Instrumentation
This field includes the study and development of instrumentation techniques and principles used to measure physical, physiological, and biological factors in living organisms. We utilize fluorometry as the optical technique to acquire fluorescence signals of intrinsic tissue fluorophores. We have designed an optoelectronic instrument called a fluorometer (Figure c). This instrument is equipped with a filter wheel, to accommodate up to 10 excitation wavelengths, a bifurcated fiber optic bundle, a dichroic mirror to separate fluorophore signals, and 2 photomultiplier tubes for signal detection. The filter wheel communicates with the computer through a control box (Lambda 10-3, Sutter instrument, CA). To control PMT gain, wheel synchronization, and data acquisition, a labview program was developed. The bifurcated fiber bundle consists of high grade fused silica fibers for UV transmission (Newport instrument, NJ) with distal end of 3mm inner diameter. For fluorescence spectroscopy, the peak energy of the NADH and FAD excitation spectrum occurs at 365nm and 450nm respectively. The appropriate bandpass filters for NADH/FAD excitation are Hg01-365-25/F01-452-45. The emission filters for NADH and FAD fluorescence are HQ460/40M and HQ520/40M, respectively. We will use the fluorometer in a dark room to acquire in situ fluorescence of biological tissue under different perfusion/ventilation experimental conditions. At the beginning of each tissue experiment, we will first measure fluorescence from the surface of a standard block with fluorescent paper with the light guide at a fixed position and distance from the block. The fluorescence measurements from the tissue surface will then be normalized to the corresponding measurement from the standard to account for day to day variations in light intensity and PMT gain settings.
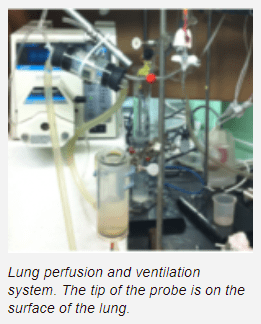
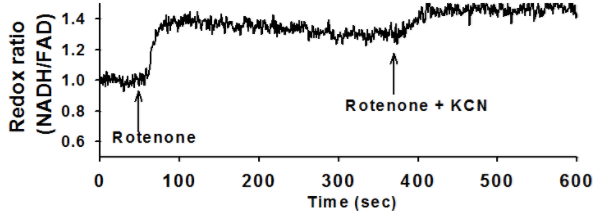
Ex vivo autofluorescent measurements of NADH and FAD are acquired using fluorometry, during which chemicals such as Rotenone, KCN, and PCP are pumped into the perfusate. A customized lung perfusion and ventilation system is used to perfuse normal lungs and evaluate the effect of mitochondrial metabolic pathway alterations. The lung undergoes an initial reduction through perfusion with Rotenone, and further reduction through perfusion with KCN. Both of these changes are seen in the fluorescent signals acquired.
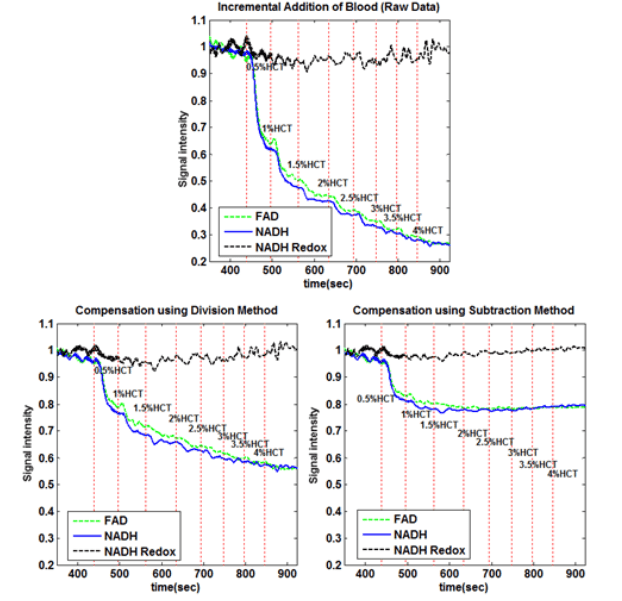
Fluorescence measurements are advantageous in various ways, but suffer in that they are susceptible to external factors, such as hemodynamics. For this reason, two methods of correction were used to compensate for changing blood concentrations. In both of these methods, the reflectance from the source is measured simultaneously with the fluorescence. In the first method, division, the fluorescence is then corrected by simply dividing the fluorescence signals by the reflectance signals. In the second method, subtraction, the signals are first normalized to baseline, and then the reflectance signals is subtracted from the fluorescence. The results of both methods can be seen below.